December 18th, 2024
New
Dedicated Analytics page 📈
What is it?
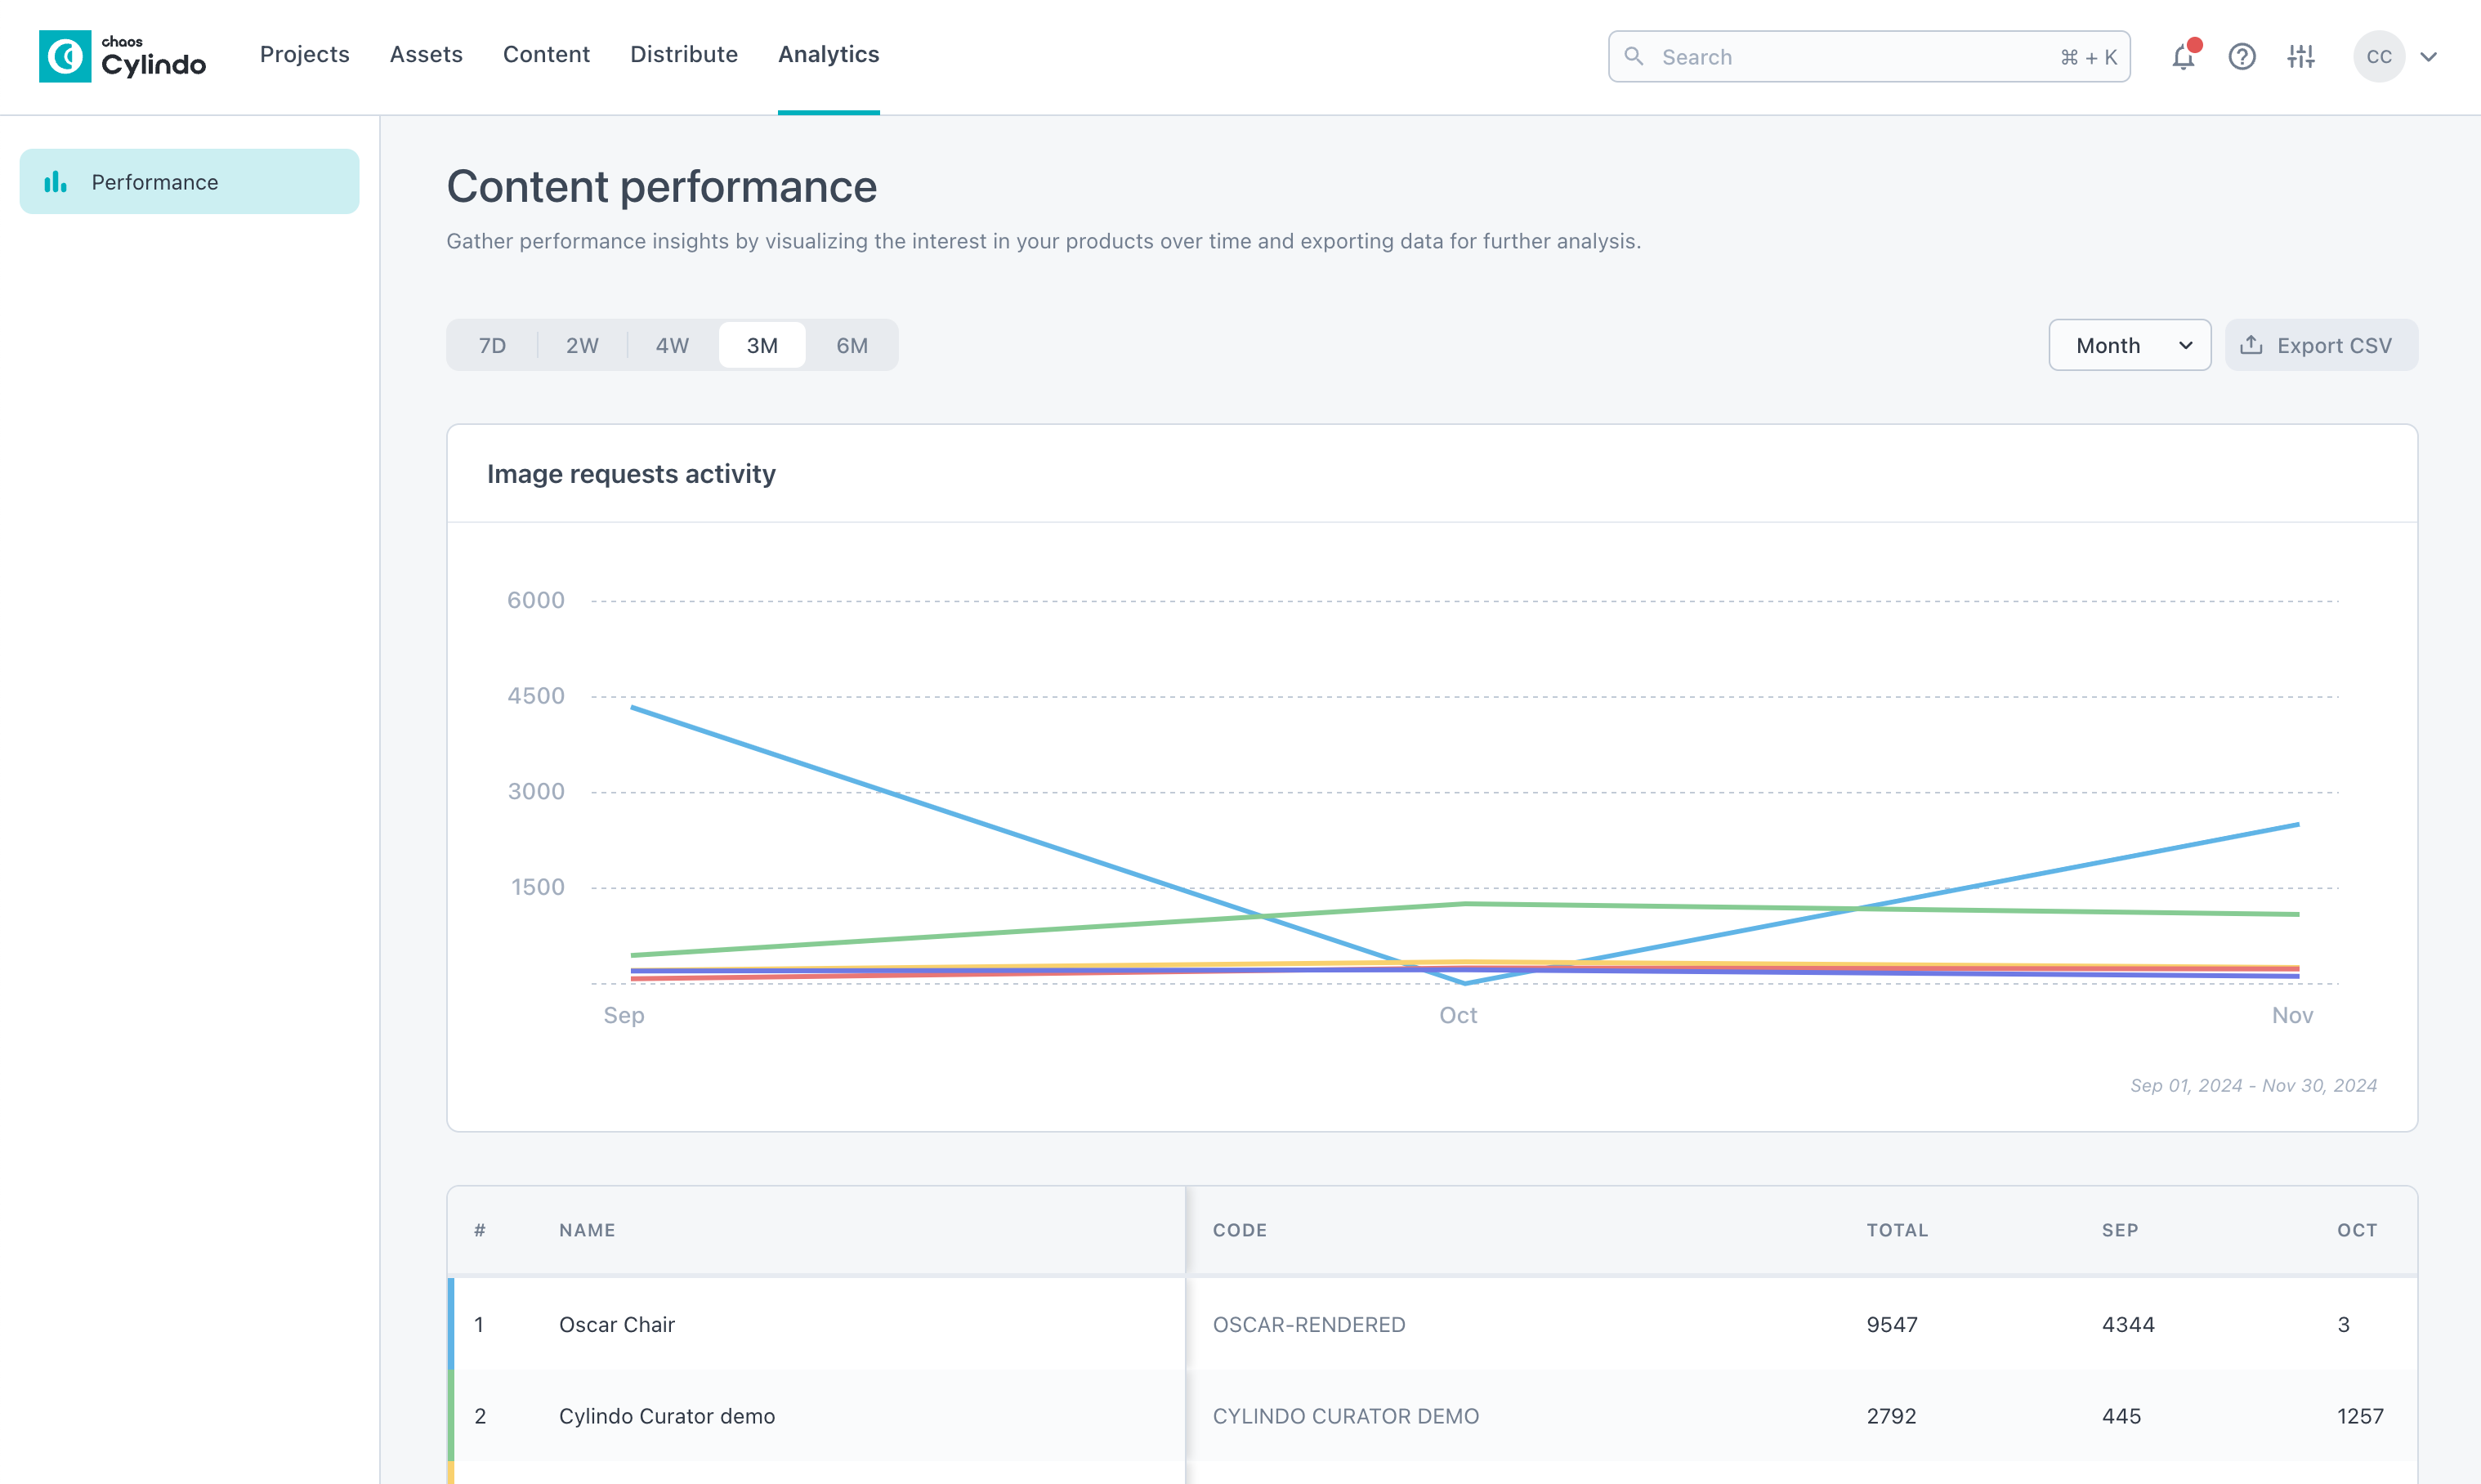
The new Analytics page provides a dedicated place to access detailed insights into how your Cylindo content—like 360 HD and Studio Lifestyle images—is performing. By tracking metrics such as image views, user interactions, and product configurations, this feature helps you measure the impact and effectiveness of your visual content.
Why it Matters?
Understanding the performance of your content is critical for making informed decisions. With this new feature, you can:
Boost Engagement: Identify top-performing content and configurations to optimize customer experiences.
Streamline Strategy: Leverage data to refine your visual content strategy.
Gain Flexibility: Tailor performance visualizations with adjustable time ranges and data groupings.
These analytics empower you to focus on what resonates most with your audience.
How it Works?
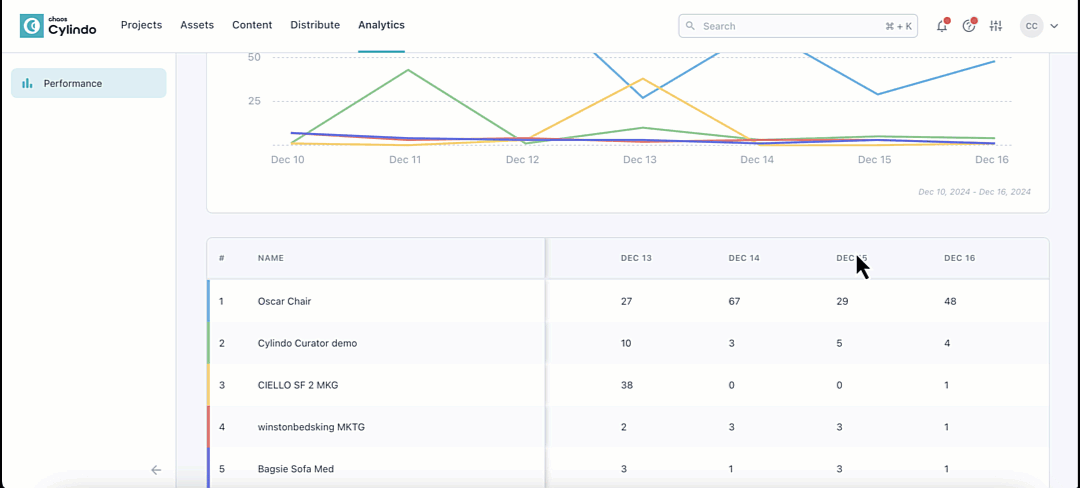
Access performance data for content served via the Content API and 360 HD Viewer.
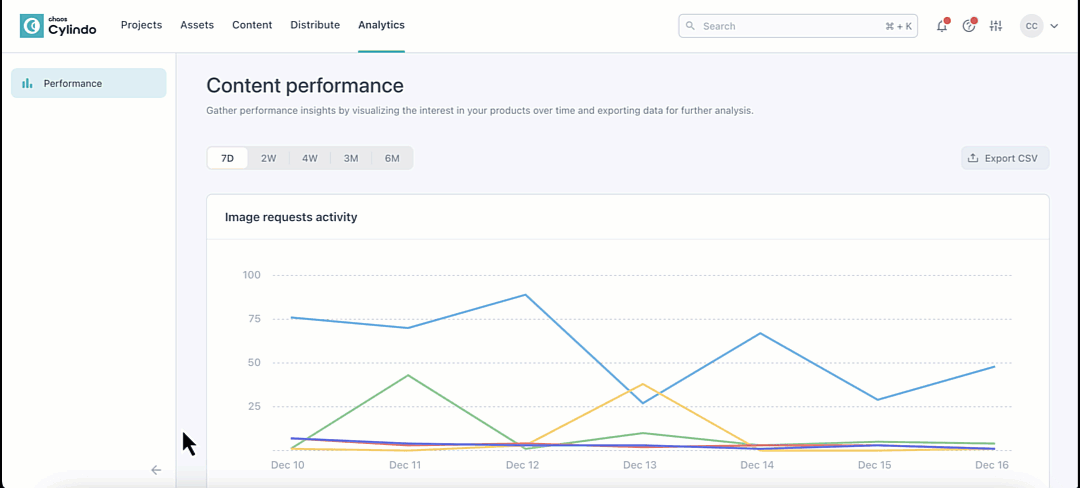
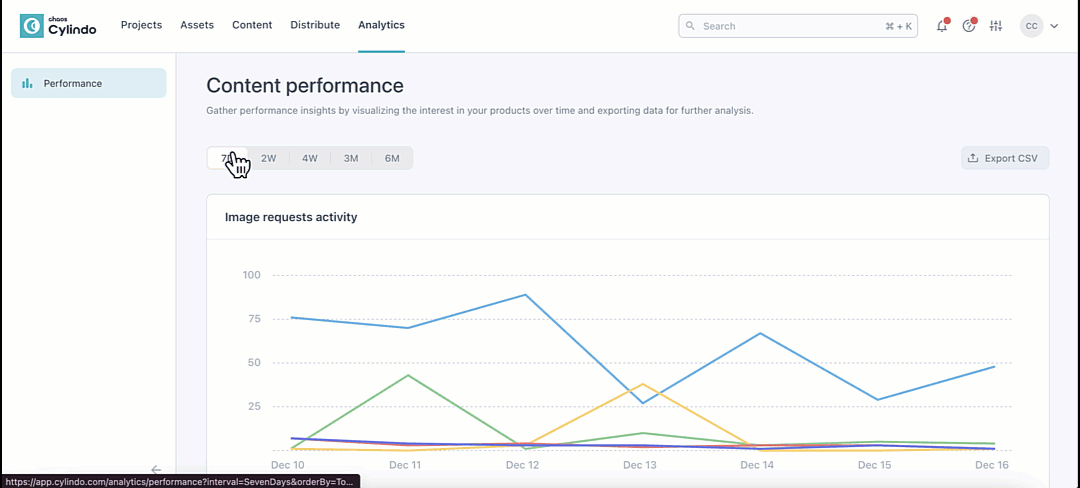
Use time range filters (7 days to 6 months) to select the date range you would like to analyze. Choose to group the data by month, week, or day for tailored insights.
See a breakdown of the total number of images served for each product. Scroll to the right on the table to see a daily, weekly, or monthly breakdown of images served for that product.
Click on links in the data table to explore detailed analytics for individual products.
Configurations: Track unique combinations of geometries and materials served.
Unique Users: See how many distinct IP addresses interacted with your content.
Zoomed Images: Monitor the number of high-resolution (2K/4K) images served, both within and outside the viewer context.
Top Configurations: Identify the most frequently selected product configurations, including default views.